
Part 1. Reduce oceanic and atmospheric CO2

Target: Ensure that atmospheric CO2 levels do not exceed 400 ppm over the next few decades, while aiming for a longer term target of 350 ppm.
James Hansen, NASA's top climate scientist, says in Target CO2: Where Should Humanity Aim? that atmospheric CO2 should be reduced to 350 ppm. To achieve this target, several policies will need to work in parallel with each other.
1.1. Dramatic cuts in CO2 emissions
In many cases, dramatic cuts in CO2 emissions can be achieved merely by electrifying transport and shifting to generation of energy by clean facilities such as solar panels and wind turbines.  Each nation should aim to reduce their CO2 emissions by a minimum of 8% per year over the next ten years, based on their 2009 emissions, and by 80% by 2020.
Each nation should aim to reduce their CO2 emissions by a minimum of 8% per year over the next ten years, based on their 2009 emissions, and by 80% by 2020.
1.2. Carbon must also be actively removed from the atmosphere and the oceans
A study at the University of Calgary concludes that, even if we completely stopped using fossil fuels and put no more CO2 in the atmosphere, the West Antarctic ice sheet will still eventually collapse (by the year 3000), causing a global sea level rise of at least four meters. This means that - apart from reducing emissions - there should be additional efforts to remove CO2 from the atmosphere and the oceans, in order to get CO2 down to levels as pictured on the above graph.
Carbon is naturally removed from the atmosphere and the oceans by vegetation, so it makes sense to protect forests and encourage their growth. There are ways to reduce ocean acidification, such as by adding lime to seawater, as discussed at other posts of this geoengineering blog and at this geoengineering group. Carbon capture from ambient air and pyrolysis of surplus biomass with biochar burial are some of the most promising methods to further remove carbon from the atmosphere. Biochar can also help with afforestation and prevent deforestation and land degradation. Funding of carbon air capture could be raised through fees on jet fuel.
All nations should commit to such initiatives — care should be taken that emission reductions are not substituted by carbon removal or vice versa.
Part 2. Short-term action
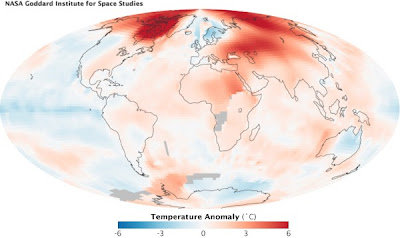
The Arctic sea ice acts as a giant mirror, reflecting sunlight back into space and thus keeping Earth relatively cool, as discussed in this open letter. If this sunlight instead gets absorbed at higher latitudes, then feedback effects will take place that result in much higher temperatures, in a process sometimes referred to as Arctic amplification of global warming.
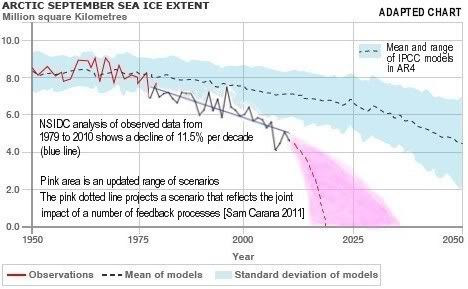
The IPCC didn't take such feedback into account in AR4. A study that used 2007/2008 data as starting point predicts a nearly sea ice free Arctic in September by the year 2037, some predict an even quicker demise. A study by by National Center for Atmospheric Research (NCAR) scientist Jeffrey Kiehl found that carbon dioxide may have at least twice the effect on global temperatures than currently projected by computer models of global climate. Melting of ice sheets, for example, leads to additional heating because exposed dark surfaces of land or water absorb more heat than ice sheets.
Albedo change is only one of a number of feedback processes. A rapid rise of Arctic temperatures could lead to wildfires and the release of huge amounts of carbon dioxide and methane that are now stored in peat, permafrost and clathrates, which constitutes further feedback that could cause a runaway greenhouse effect. Heat produced by decomposition of organic matter is yet another feedback that leads to even deeper melting.
2.1. Reduce methane and nitrogen oxide emissions
Reductions in the emissions of methane and nitrogen oxide can be achieved by a change in diet, improved waste handling and better land use.
Effective policies such as feebates can impose fees on nitrogen fertilizers and livestock products, while using the revenues to fund pyrolysis of organic waste.
2.2. Emissions of other pollutants than conventional greenhouse gases should also be reduced
Both the Kyoto Protocol and the IPCC have focused much on reducing CO2 emissions, as well as other conventional greenhouse gases such as methane and nitrogen oxide. Melting in the Arctic carries the risk of huge additional emissions from peat, permafrost and clathrates, which calls for more immediate mitigation action.
All nations should therefore commit to short-term mitigation — long-term mitigation efforts should not be substituted by short-term mitigation or vice versa.
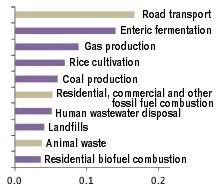 As this NASA study points out, for more effective short-term impact, drastic cuts should also be made in other pollutants, such ozone, soot and carbon monoxide. This is further illustrated by the image on the right that shows what causes most radiative forcing (W/m2) when taking into account all pollutants over a 20-year period, from a study published in Science. Reducing short-lived pollutants could significantly reduce warming above the Arctic Circle, finds a study published in Journal of Geophysical Research.
A relatively cheap way to achieve such cuts is by encouraging the use of solar cookers and rechargeable batteries to power LED lights. Many types of equipment and appliances can also be powered this way, even when batteries are recharged by hand cranking or pedaling. Electrification of road transport is a crucial part of short-term action, as illustrated by the image, while generation of energy from clean facilities such as solar panels and wind turbines (as also discussed under part 1.1.) will further contribute to reductions in short-lived pollutants.
Furthermore, reductions in short-lived pollutants can be achieved by preservation of forests, which justifies financial assistance by rich countries. As said, such assistance should not be used by rich nations as a substitute for domestic action — action is also required domestically by each nation, on all points.
The desired shifts can often best be accomplished locally by budget-neutral feebates, i.e. fees on local sales of fuel, engines and ovens, each time funding the better local products, as illustrated by the image below.
As this NASA study points out, for more effective short-term impact, drastic cuts should also be made in other pollutants, such ozone, soot and carbon monoxide. This is further illustrated by the image on the right that shows what causes most radiative forcing (W/m2) when taking into account all pollutants over a 20-year period, from a study published in Science. Reducing short-lived pollutants could significantly reduce warming above the Arctic Circle, finds a study published in Journal of Geophysical Research.
A relatively cheap way to achieve such cuts is by encouraging the use of solar cookers and rechargeable batteries to power LED lights. Many types of equipment and appliances can also be powered this way, even when batteries are recharged by hand cranking or pedaling. Electrification of road transport is a crucial part of short-term action, as illustrated by the image, while generation of energy from clean facilities such as solar panels and wind turbines (as also discussed under part 1.1.) will further contribute to reductions in short-lived pollutants.
Furthermore, reductions in short-lived pollutants can be achieved by preservation of forests, which justifies financial assistance by rich countries. As said, such assistance should not be used by rich nations as a substitute for domestic action — action is also required domestically by each nation, on all points.
The desired shifts can often best be accomplished locally by budget-neutral feebates, i.e. fees on local sales of fuel, engines and ovens, each time funding the better local products, as illustrated by the image below. 2.3. Furthermore, consider ways to reflect more solar radiation back into space
Discussions of ways to reflect solar radiation can be found at other posts of this geoengineering blog and furthermore at this geoengineering group.
Part 3. Adaptation
Look at policies that can help people, flora and fauna adapt to climate change. Rich nations are urged to give financial assistance to poorer nations, as well as to facilitate technology transfer, including by preventing that intellectual property protection acts as a barrier to such transfer.
3.1. Prepare for extreme weather events
Look at safety issues from the perspective of a changed world. Prepare for hailstorms, heavy flooding, severe droughts, wildfires, etc., and grow food that fits such weather patterns best.
3.2. Preserve biodiversity
Protection of rain forests is well covered in the media. Biodiversity can be further preserved by means of seed banks, parks and wildlife corridors.
3.3. Vegetate
Fresh water supply and food security require extensive planning, such as selection of best crop. Build facilities for desalination both for fresh water in cities and to irrigate and vegetate deserts and other areas with little vegetation.

image from: Towards a sustainable Economy
Leading global warming experts are invited to contribute comments and thoughts as to what constitutes an effective global warming action plan
 Arctic sea ice cover in December 2010 was the lowest on record for the month,


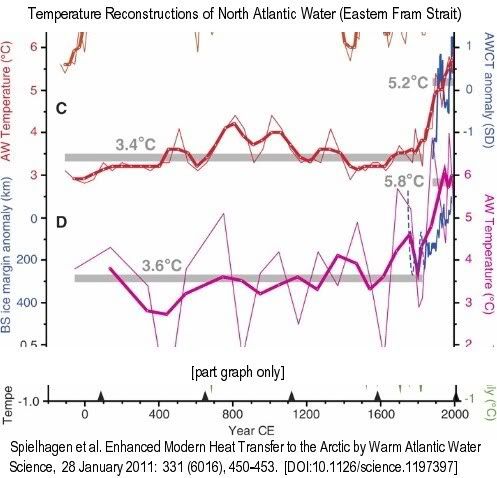 Thin lines are raw data, bold lines are three-point running means…. (C) Summer temperatures at 50-m water depth (red)…. Gray bars mark averages until 1835 CE and 1890 to 2007 CE. Blue line is the normalized Atlantic Water core temperature (AWCT) record … from the Arctic Ocean (1895 to 2002; 6-year averages)…. (D) Summer temperatures (purple) [calculated with a different method]
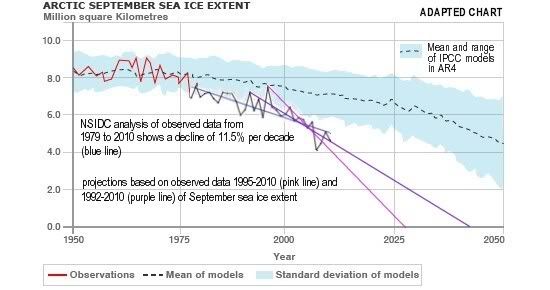


