Showing posts with label emissions. Show all posts

Wednesday, May 20, 2015

Kelp Farming and Ice Dyking

Aaron Franklin
Kelp farming and ice dyking for habitat enhancement 
and carbon-negative fuels and chemical production.

By Aaron Franklin

A purpose-built craft like this Ground effect plane / hovercraft triphibian concept could be ideal.

The laterally-rigid sideskirts with vertically-flexible surface-contouring ski bottoms would allow transitions between air, water, ice, snow, earth surfaces of all types and the waterscoop tail could directly hose the water onto the ice with foil effect to counter lateral reaction thrust. Snow making, firefighting, and ecology seeding also in its functionality.


At pumping of 10tons per second, 50m x 100m/s = 5000sqm, 10000kg/5000sqm = 2 kg per sqm per pass. About 2mm per pass.

If we assume conditions that will allow 2 mm to freeze in 30 seconds. then 4mm per minute = 240mm per hour = 5760mm (near 6m thick) per day could be made of 50m wide by 100m/s x 30s = 3km long of icedyke by a mobile spray vehicle at 100m/s.

3000m x 6m x 50m = 900 000 tons per day of ice making.

A fleet of 50 working for 100 days therefore could make 5000 x 900 000 = 45 000 000 000 tons or near 5 cubic kilometers of ice. 

If we are looking at an average needed to ground them of say 30m thick, then 50m wide is cross section area of 1500 sqm.

5 000 000 000 cubic m / 1500 sqm = 3.33333 million meters or 3333 km.

A ball park figure of 1000kw vehicle power would seem adequate to do this.

Very likely a rope mesh reinforcement would need to be floated on the water and anchored in place to hold together the dyke that has been formed. Doing this work in polynyas seems the best way, then towing into position of sections to be anchored and further thickened.

If 100 such vehicles were used you've got near seven thousand km of icedyke which could be enough for such a layout as this:
Kelp farming, by Aaron Franklin, on background image by Shakhova et al., 2010

For methane plume hotspots to the surface, hexagonal tiles would need to be formed and towed into place, if they are too rich for ice to form inside the rings in situ.

Stationary pumping systems might have to high costs per area in most places with limits to small volumes per pump due to area feasible to distribute the water to and ice layup rates. Though in saying this, high cost is often seen as a benefit for commercial interests. They can make more money doing it the hard way.

The purposes of kelp farming in the less methane emissive areas is as follows:
  • Biomass for biofuels and biochemicals of around 500 ton per hectare per year can be harvested.
  • The growing kelp oxygenates the water to support consumption of methane and river in-flux of organic carbon.
  • The artificial kelp forests provide habitat and food for a diverse and rich ecology with fisheries and abalone/ mussel/ crabs / lobster etc farming potential
  • Unlike micro algae, the kelp biomass is easily harvested, so it would not rot and cause oxygen depletion of the water at the end of summer.
  • Sedimentation rates and water clarity are vastly improved by the kelp forests, thereby improving albedo and enhancing natural carbon burial in sediments.
  • Simple and low cost infrastructure only is neccessary to process the kelp locally into liquids for low transport costs to refineries for further upgrading.
  • It would be easy to use the CO2 from an initial biomass pyrolysis to convert methane collected nearby to methanol for easy low cost transportation.
Combining these systems would allow zero carbon emission liquid fuels via the energy component of the fossil methane and biomass being used as hydrogen and the carbon turned into biochar and high performance bioglues and recyclable polymers, allowing further long-term carbon sequestration by wood, biofibre, etc., and component for construction materials, also replacing high carbon-emission steel, concrete etc.

Friday, April 5, 2013

Klaus Lackner works on carbon capture technology

Klaus Lackner,
Columbia University
Professor Klaus Lackner, director of the Lenfest Center for Sustainable Energy at the Earth Institute, at Columbia University, is working on technology to scrub carbon dioxide from the air. “Our goal is to take a process that takes 100,000 years and compress it into 30 minutes,” says Lackner.

Direct air capture of carbon dioxide is a method that takes carbon dioxide out of ambient air, as opposed to carbon dioxide that is captured from the point of emissions, say, from the smokestack of a coal-fired power plant.

Lackner and his team are developing a device they call an air extractor, modeled after what is most abundant in nature: the leaf of a tree. There is about 0.5 liter of carbon dioxide in a cubic meter of atmosphere. When the extractor is dry, it loads itself with carbon dioxide from the air; when it's wet it releases carbon dioxide it has captured.

“We can do this at a cost of about $30 a ton of carbon dioxide”, says Lackner, “we have designed a box that can extract about a ton of carbon dioxide a day; it fits into a shipping container”. “If we had 100 million of them", Lackner adds, “we could extract more carbon dioxide out of the air then is currently put in.”

The carbon can be stored in the form of mineral carbonate rock or it can be injected deep in the ground. Alternatively, the carbon dioxide can be used, e.g. by turning it into a fuel. Airplanes will likely need to be powered by fuel for a long time, so captured carbon dioxide could be used to more sustainably produce synthetic jetfuel.

In his lab at Columbia's Engineering School, Lackner has built a small greenhouse, demonstrating that  air extractors loaded with captured carbon dioxide can be placed inside a greenhouse; the humid atmosphere inside the greenhouse will make that the carbon dioxide is released. Adding carbon dioxide to the air inside greenhouses is beneficial for plant growth; the plants will take the carbon dioxide out of the air and use it to grow.


References

- Prof. Klaus Lackner Takes Step Toward Workable Carbon Capture Technology
http://news.columbia.edu/carbondioxide

- Klaus S. Lackner, Director of the Lenfest Center for Sustainable Energy, Columbia Universityhttp://www.earth.columbia.edu/articles/view/2523

- Prof. Klaus Lackner Takes Step Toward Workable Carbon Capture Technolog . .
http://www.youtube.com/watch?v=qGL21j10C8Q

- Direct Air Capture of Atmospheric Carbon Dioxide
http://large.stanford.edu/courses/2011/ph240/mccurdy1/

- The Great Debate: CLIMATE CHANGE - Surviving The Future (1:15 to 1:24)
http://www.youtube.com/watch?v=XPaTAC29W2I

- Funding of Carbon Air Capturehttp://geo-engineering.blogspot.com/2009/05/funding-of-carbon-air-capture.html

- Removing carbon from air - Discovery Channel
http://geo-engineering.blogspot.com/2008/10/removing-carbon-from-air-discovery.html

Sunday, January 16, 2011

2011 starts with lowest Arctic sea ice extent on record

The year 2010 was the warmest year on record, as confirmed by the WMO and as illustrated by the NOAA graph below.
This is the more dramatic given that we’re in the middle of a strong La NiƱa, which pushes temperatures down, while we’ve been in “the deepest solar minimum in nearly a century.” NOAA has meanwhile published the data for 2010. A chart based on NOAA data is added below, with standard polynomial trendline added.
As the NASA map below shows, temperature anomalies are especially prominent at higher latitudes, close to the Arctic. 
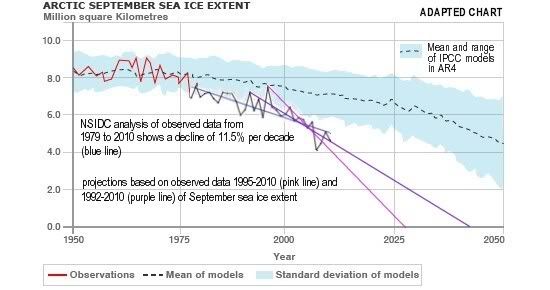
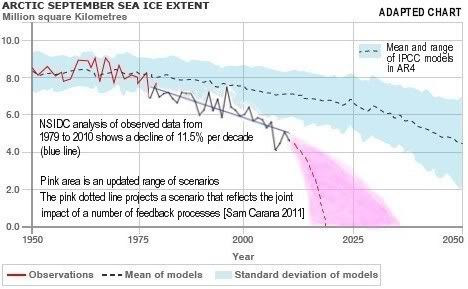
Arctic sea ice cover in December 2010 was the lowest on record for the month, said the WMO, adding that sea ice around the northern polar region shrank to an average monthly extent of 12 million square kilometres, 1.35 million square kilometres below the 1979 to 2000 December average. Furthermore, 2011 has started with the lowest Arctic sea ice extent on record for this time of the year, as shown on the International Arctic Research Center graph below.
On the NSIDC graph below, monthly September ice extent for 1979 to 2010 shows a decline of 11.5% per decade.
The NSIDC image below shows that, at the end of the summer 2010, under 15% of the ice remaining in the Arctic was more than two years old, compared to 50 to 60% during the 1980s. There is virtually none of the oldest (at least five years old) ice remaining in the Arctic (less than 60,000 square kilometers [23,000 square miles] compared to 2 million square kilometers [722,000 square miles] during the 1980s).
Why is all this so important? The Arctic sea ice acts as a giant mirror, reflecting sunlight back into space and thus keeping Earth relatively cool, as discussed in this open letter. If this sunlight instead gets absorbed at higher latitudes, then feedback effects will take place that result in much higher temperatures, in a process sometimes referred to as Arctic amplification of global warming.
Above image is from a recent study, which found that 2010 set a record for surface melting over the Greenland ice sheet. The study warns that surface melt and albedo are intimately linked: as melting increases, so does snow grain size, leading to a decrease in surface albedo which then fosters further melt. A recent study concludes that the rate of Arctic sea ice decline appears to be accelerating due to positive feedbacks between the ice, the Arctic Ocean and the atmosphere. As Arctic temperatures rise, summer ice cover declines, more solar heat is absorbed by the ocean and additional ice melts. Warmer water may delay freezing in the fall, leading to thinner ice cover in winter and spring, making the sea ice more vulnerable to melting during the next summer.
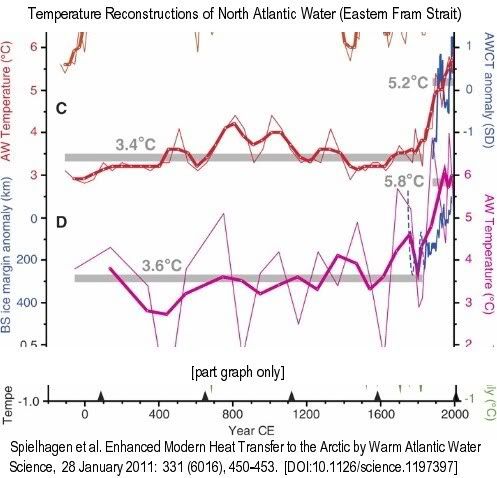
Thin lines are raw data, bold lines are three-point running means…. (C) Summer temperatures at 50-m water depth (red)…. Gray bars mark averages until 1835 CE and 1890 to 2007 CE. Blue line is the normalized Atlantic Water core temperature (AWCT) record … from the Arctic Ocean (1895 to 2002; 6-year averages)…. (D) Summer temperatures (purple) [calculated with a different method]
The IPCC didn't take such feedbacks into account and didn't foresee a total September sea ice loss in the Arctic for this century. Many scientists have repeatedly warned about this, as mentioned in this early 2009 post and this early 2010 post.
Projections that start with more recent data will take some of this feedback into account. Projections that start with 1992 and 1995 data, as in the pink and purple lines on above image, predict a total loss of September Arctic sea ice by 2040 or 2030. A study that used 2007/2008 data as starting point predicts a nearly sea ice free Arctic in September by the year 2037. Albedo change is only one of a number of feedback processes. A rapid rise of Arctic temperatures could lead to wildfires and the release of huge amounts of carbon dioxide and methane that are now stored in peat, permafrost and clathrates, which constitutes further feedback that could cause a runaway greenhouse effect. Heat produced by decomposition of organic matter is yet another feedback that leads to even deeper melting.
The cumulative impact of multiple feedback processes and their interaction reinforces and accelerates Arctic warming, making downward curved projections more applicable than straight line extrapolation of earlier data. The pink dotted line on above chart shows a scenario that reflects the impact of a number of feedback processes. A study at the University of Calgary concludes that, even if we completely stopped using fossil fuels and put no more CO2 in the atmosphere, we've already added enough carbon in the oceans to cause the West Antarctic ice sheet to eventually collapse (by the year 3000), resulting in a global sea level rise of at least four meters. In other words, we have already passed the tipping point for the West Antarctic ice sheet, and additional emissions could cause its collapse to occur much earlier. According to a study published in the journal Nature Geoscience, ice and snow in the Northern Hemisphere are now reflecting on average 3.3 watts of solar energy per square meter back to space, a reduction of 0.45 watts per square meter between 1979 and 2008. "The rate of energy being absorbed by the Earth through cryosphere decline – instead of being reflected back to the atmosphere – is almost 30% of the rate of extra energy absorption due to CO2 increase between pre-industrial values and today," co-author Karen Shell said. A study by by National Center for Atmospheric Research (NCAR) scientist Jeffrey Kiehl found that carbon dioxide may have at least twice the effect on global temperatures than currently projected by computer models of global climate. Melting of ice sheets, for example, leads to additional heating because exposed dark surfaces of land or water absorb more heat than ice sheets. Without changes, this new study warns, Earth's average temperature appears set to rise this century by 29°F (16°C), to levels never before experienced in human history. Such a rise would make that many areas on Earth would become too hot to live in. Humans and other mammals cannot survive prolonged exposure to temperatures exceeding 95°F (35°C), says Steven Sherwood. Heat stress would make many parts of the globe uninhabitable with global-mean warming of about 7°C (12.6°F). Warming of about 21°F (11-12°C) would make places where most people now live uninhabitable. I have made recommendations to deal with global warming for years, most recently in this Global Warming Action Plan. What do you think should be done?

Monday, April 20, 2009

Open Letter to Major Economies Forum on Energy and Climate

Forum Participants,

We, a group of scientists, researchers and other people sharing a strong background and interest in climate change, are concerned that the Forum's sole focus will be on the politics of energy, as seems confirmed by the name of the Forum.

We believe that the scientific evidence strongly suggests that the approach to the climate change problem should be as broadly based as possible. As such, this should include the following four parts:
Part A: Emissions reduction
Part B: Carbon stock management
Part C: Heat transfer and radiation management
Part D: Adaptation

We note that there is little or no funding for research and testing of geoengineering methods (in Part B and Part C). These should be urgently considered as part of a comprehensive approach to climate change.

Signatories:
- John Nissen (jn@cloudworld.co.uk)
- Andrew Lockley (Former director of Friends of the Earth ENWI - UK)
- Peter Read (Hon. Research Fellow, Massey University Centre for Energy Research - NZ)
- Bill Fulkerson (Senior Fellow, Institute for a Secure and Sustainable Environment, University of Tennessee)
- Dan Wylie-Sears
- Eugene I. Gordon
- John Gorman (MA (Chartered Engineer MIMechE, MIET - UK)
- Jim Woolridge (former Climate and Energy Campaigner, Earthwatch/Friends of the Earth, Ireland)
- Sam Carana (contributor to feebate.net - sam.carana@gmail.com)

References:
White House Announcement of Major Economies Forum (MEF)
White House Announcement of Mexico MEF Meeting
Department of State Annoucement of MEF
Open letter to Dr Rajendra K. Pachauri, IPCC chair (Gather)
Open letter to Dr Rajendra K. Pachauri, IPCC chair (Geo-engineering)
Open Letter to Major Economies Forum Participants (background)