A research team at Stanford University, led by Dr. Julia Pongratz, finds that solar-radiation geoengineering in a high-CO2 climate generally causes crop yields to increase, largely because temperature stresses are diminished while the benefits of CO2 fertilization are retained.
The team adds that, nevertheless, possible yield losses on the local scale as well as known and unknown side effects and risks associated with geoengineering indicate that the most certain way to reduce climate risks to global food security is to reduce emissions of greenhouse gases.
Paper: Crop yields in a geoengineered climate
Press release: Geoengineering and global food supply
Showing posts with label geoengineering. Show all posts
Showing posts with label geoengineering. Show all posts
Sunday, January 22, 2012
Monday, April 18, 2011
How would you allocate US$10 million per year to most reduce climate risk?
Imagine that you had a budget of $10 million per year and that you should maximize the amount of climate risk reduction obtainable with that $10 million, what would you allocate it to and why?
Given the scary situation in the Arctic, I would apportion parts of the $10 million to methods that promise immediate results:
At first, as a test, two such small aircraft could navigate on auto-pilot to the north of Canada and Alaska at the start of Spring on the Northern Hemisphere.
In subsequent years, numerous such planes could follow, also going to other parts of the Arctic. At the end of Summer, the planes could return home for a check-up and possible upgrade of the technology, to be launched again the next year.
There are many self-financed clubs where members build and fly remote controlled aircraft, as discussed in comments underneath this post.
Even a small financial incentive could help such clubs make a lot progress and give them a goal, while the publicity would also make people more aware of the problems we face in the Arctic.
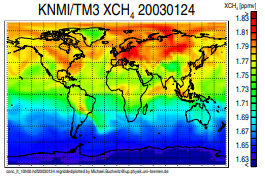 Such aircraft could navigate the Arctic, guided by satellite detection of methane concentrations (image left) and by equipment carried onboard, such as small versions of methane analyzers.
Measuring from different vantage points can pinpoint the most suitable location to cross-aim multiple laser beams at, to minimize the energy needed to heat up methane to its point of auto-ignition (image below).
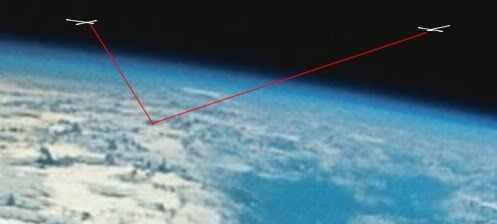
 Methane can be ignited where it is present in concentrations of between 5% and 15%. In concentrations of around 9%, methane could be ignited with as little as 0.3 mj of energy (see image, adapted from Zabetakis).
At well over 500 degrees Celsius, methane's minimum auto-ignition temperature is rather high. Other volatile hydrocarbons in the vicinity may ignite at lower temperatures (with less energy), in turn igniting the methane.
Sam Carana
For further background on the above, also see:
http://geo-engineering.blogspot.com/2011/04/runaway-global-warming.html
and
http://groups.google.com/group/geoengineering/browse_thread/thread/5eaf812314dced8c
Given the scary situation in the Arctic, I would apportion parts of the $10 million to methods that promise immediate results:
- R&D and testing of SRM methods such as surface brightening and marine cloud brightening.
- R&D and testing of ways to ignite or break down methane from the sky, i.e. from airplanes or satellites. Laser beams spring to mind. Another technology that could be looked at further is to focus short, amplified pulses of light on water vapor, hydrogen peroxide or ozone, in efforts to produce more hydroxyl (OH) which could in turn oxidize as much methane as possible.
- Building on the outcome of 2., equipping small aircraft with such technology, as well as autopilot software, GPS, LiPo batteries and with solar thin film mounted both on top of and underneath the wings.
 |
| example aircraft |
In subsequent years, numerous such planes could follow, also going to other parts of the Arctic. At the end of Summer, the planes could return home for a check-up and possible upgrade of the technology, to be launched again the next year.
There are many self-financed clubs where members build and fly remote controlled aircraft, as discussed in comments underneath this post.
Even a small financial incentive could help such clubs make a lot progress and give them a goal, while the publicity would also make people more aware of the problems we face in the Arctic.
Measuring from different vantage points can pinpoint the most suitable location to cross-aim multiple laser beams at, to minimize the energy needed to heat up methane to its point of auto-ignition (image below).

At well over 500 degrees Celsius, methane's minimum auto-ignition temperature is rather high. Other volatile hydrocarbons in the vicinity may ignite at lower temperatures (with less energy), in turn igniting the methane.
Sam Carana
For further background on the above, also see:
http://geo-engineering.blogspot.com/2011/04/runaway-global-warming.html
and
http://groups.google.com/group/geoengineering/browse_thread/thread/5eaf812314dced8c
Call for action
As a result of emissions of pollutants around the world, massive amounts of greenhouse gases are threatening to be released in the Arctic. This calls for action. In addition to long-term measures to mitigate climate change and remove pollutants from oceans and atmosphere, geoengineering in the Arctic should now be included in our efforts to avoid catastrophe.
Undersigned:
Sam Carana, editor of Geo-engineering.blogspot.com
Comments and further signatories are welcome.
Undersigned:
Sam Carana, editor of Geo-engineering.blogspot.com
Comments and further signatories are welcome.
| Geo-engineering.blogspot.com Creative Commons License | Please spread this call for action widely, adding CC and link as footer underneath. |
| ||||||
Friday, April 15, 2011
Runaway Global Warming
1. Methane releases in the Arctic
 On June 15, 2011, the research vessel Polarstern (Wikipedia photo right) of the Alfred Wegener Institute for Polar and Marine Research will set off on its 26th arctic expedition.
According to the press release, scientists onboard the vessel plan to take seafloor samples from a marine area in which fishery echosounders recently detected numerous gas flares. They indicate that probably enormous quantities of methane are released from the seafloor at water depths of around 400 metres west of Svalbard.
Scientists have been researching the potential for methane releases in the Arctic for years. One of the dangers with climate change is that hydrates could become destabilized, causing huge amounts of methane to be released, in turn accelerating warming.
The East Siberian Arctic Shelf is a region about 2,000,000 km2 large that, due to polar amplification of global warming, can now be 10°C or 18°F warmer than it was from 1951 to 1980 (NASA image below).
 Shakhova and Semiletov (2010) conclude that this ESAS region should be considered the most potential in terms of possible climate change caused by abrupt release of methane.
A press release accompanying a widely-reported study published in Science in 2010 explains that in the shallows of the East Siberian Arctic Shelf, methane simply doesn't have enough time to oxidize, which means more of it escapes into the atmosphere. That, combined with the sheer amount of methane in the region, could add a previously uncalculated variable to climate models.
"The release to the atmosphere of only one percent of the methane assumed to be stored in shallow hydrate deposits might alter the current atmospheric burden of methane up to 3 to 4 times," Shakhova warns.
A 2008 paper by Shakhova et al. considered release of up to 50 Gt of predicted amount of hydrate storage as highly possible for abrupt release at any time. Such a release could multiply the atmospheric methane burden by up to 11 times.
2. Abrupt merthane releases
As permafrost melts, algae and bacteria can flourish, contributing methane through their metabolism. Even more worrying, collapse of methane hydrates can cause abrupt release of huge amounts of methane.
Rising temperatures can cause hydrates to collapse, resulting in abrupt release of huge amounts of methane. Anomolies of up to 12.5°C show up on the image below with average temperatures for November 2010.

For individual days and locations, the anomaly can be even more striking. On January 6, 2011, the minimum temperature in Coral Harbour, located at the northwest corner of Hudson Bay in the province of Nunavut, Canada, was –3.7°C (25.3°F), i.e. 30°C (54°F) above average.
How high can temperatures rise in the Arctic? Below are projections based on above NASA data.

Methane hydrates are held together by high pressure and low temperatures. They can collapse when the temperature rises, or when pressure falls, e.g. when hydrates are disturbed by earthquakes and associated tsunamis, shock-waves and land-slides. Thermal expansion of land and water can put additional stress on areas prone to seismic activity. Furthermore, as ice and glaciers in the mountains melt away, a substantial weight is disappearing, changing pressures that act on the Earth's crust and contribute to seismic activity. This link was confirmed in several scientific studies, such as this one dating back to 2003. Drilling and fracking in these hydrates could make things worse and trigger abrupt releases of huge amounts of methane.
Collapse of a single hydrate can accelerate local warming, in turn causing further hydrates to similarly start adding large amounts of methane to the atmosphere, as further described below.
3. Oxygen depletion
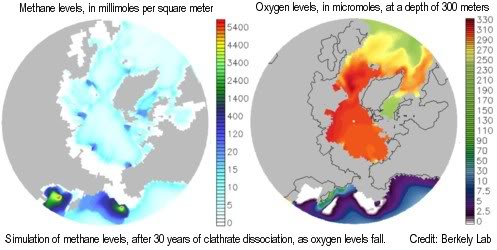
At the moment, methane releases from undersea sediments may still become oxidized in the water. However, a two-part study by Berkeley Lab and Los Alamos National Laboratory shows that, as global temperature increases and oceans warm, methane releases from clathrates would over time cause depletion of oxygen, nutrients, and trace metals needed by methane-eating microbes, resulting in ever more methane escaping into the air unchanged, to further accelerate climate change.
4. Hydroxyl depletion in the air
To make matters even more catastrophic, high methane concentrations will result in an absence of enough hydroxyl in the air for all this methane to be oxidized. A 2009 study by Drew Shindell found that increases in global methane emissions did cause a 26% hydroxyl decrease. Because of this, methane now persists longer in the atmosphere, before getting transformed into the less potent carbon dioxide.
A Centre for Atmospheric Science study suggests that sea ice loss may amplify permafrost warming, with an ice-free Arctic featuring a decrease in hydroxyl of up to 60% and an increase of tropospheric ozone (another greenhouse gas) of up to 60% over the Arctic. This lack of hydroxyl means that methane will persist in the atmosphere for longer at its high global warming potency.
5. Local concentration of methane
Earth has 510,072,000 km2 of surface, or more than 255 times that of the East Siberian Arctic Shelf. Initial concentration of that much methane in the Arctic makes things even worse. While methane can spread out quickly, it will initially be concentrated where it is released. A major methane release in the high Arctic would take 15-40 years to spread to the South Pole. This methane will allow less heat from sunlight in summer to escape into space, while the sun doesn't set. This could therefore cause summer temperatures to rise dramatically in the Arctic, in turn causing further melting and more warming than we're already witnessing now.
6. Methane's high initial Global Warming Potential
Particularly worrying about methane is its high global warming potential, which can be made worse due to the above points, i.e. lack of oxygen in water, resulting in ever less methane oxidation in water, hydroxyl depletion in the air and local concentration of methane. All this may increase methane's global warming potential.

In its first five years, methane is at least 100 times as potent as carbon dioxide as a greenhouse gas (above image below, from a study by Dessus). Abrupt releases of 15 Gt (or Pg) of methane would result in a burden of 20 Gt of methane (since there already is about 5 Gt in the atmosphere). Applying a global warming potential of 100 times carbon dioxide would give this 20 Gt of methane an initial greenhouse effect equivalent to 2000 Pg of carbon dioxide.
By comparison, atmospheric carbon dioxide levels rose from 288 ppmv in 1850 to 369.5 ppmv in 2000, for an increase of 81.5 ppmv, or 174 PgC. What makes things even worse is that this 174 PgC was spread out over the globe, whereas methane from such abrupt releases in the Arctic would - at least initially - be concentrated in a relatively small area.
Extension of methane's lifetime further amplifies its greenhouse effect, especially for releases that are two or three times as large as current releases.
 The graph on the right, based on data by Isaksen et al. (2011), shows how methane's lifetime extends as more methane is released.
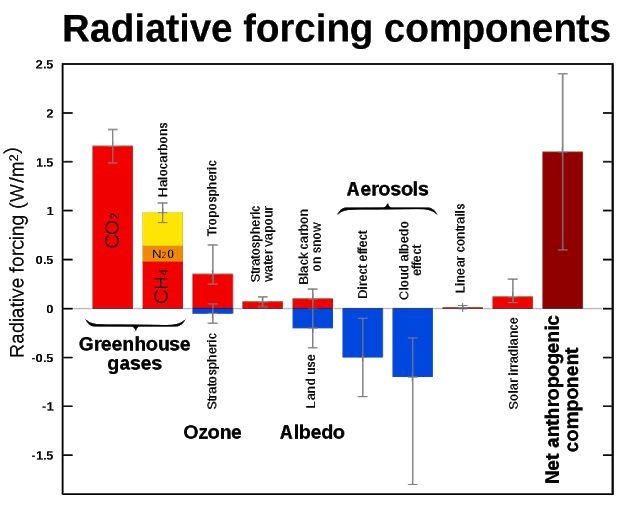
The GWP for methane typically includes indirect effects of tropospheric ozone production and stratospheric water vapor production. The study by Isaksen et al. shows (image below) that a scenario of 7 times current methane levels (image below,medium light colors) would correspond with a radiative forcing of 3.6 W/m-2.

Such an increase in methane would thus add more than double the entire current net anthropogenic warming, effectively tripling the effect of all emissions added by people since the industrial revolution (for comparison, see the IPCC AR4 SPM and Wikipedia image below).
An addition of less than 30 Pg of methane could create such a scenario (i.e. of 7x the methane we're used to having in the atmosphere) and this would extend methane's lifetime to some 18 years, so such a burden will not go away quickly. The situation is even worse when releases take place abruptly over a short period. A single submarine landslide can release 5 Pg of methane, which can double the methane currently in the atmosphere when this occurs in shallow waters, since such a huge release will saturate the water, so most methane will enter the atmosphere unchanged, to trigger further releases.
7. Runaway Global Warming
This kind of warming in the Arctic could result in ever more methane ending up in the atmosphere and remaining there for a longer period without getting oxidized. Initially, all this methane will be concentrated in the arctic, causing huge amplification of the greenhouse effect there in summer, heating up the sea and causing further depletion of oxygen (as algae start to bloom) and further accelerating the permafrost melt and thus causing further carbon to be released from permafrost and clathrates.
Such dramatic local warming is bound to trigger further melting of permafrost locally, resulting in further releases of methane. Massive amounts of methane are stored in the Arctic, much of it concentrated at high density in hydrates. One liter of hydrate can release up to 164 liters of methane. A rise in temperature could cause abrupt releases of huge amounts of methane from hydrates.
8. What can be done about it?
Once runaway global warming starts, it feeds on itself. While dramatic reduction in global greenhouse gas emissions is imperative, that alone will not be able to stop runaway global warming.
 Geoengineering methods could reflect some of the sunlight in the Arctic back into space, such as by distributing sulfur dioxide into the stratoshphere by jets, cannons or hoses, or by enhancing cloud albedo as proposed by Stephen Salter and John Latham (see image left).
Even halving the amount of sunlight may not be enough to reduce rapid warming in the region, if that would merely be like cutting methane's GWP in half. Moreover, it can take several years for warming to reach and penetrate hydrate sediments, as described by Nesbit, and once on its way, reducing surface temperature may not be able to reverse such a process quickly enough to avoid massive methane releases. In other words, the window of opportunity for solar reduction methods may already have closed.
Further methods include ways to ignite the methane using short, amplified and focused pulses of UV light from airplanes or satellites. UV light could also be used to produce more hydroxyl, in efforts to oxidize as much methane as possible.
Igniting or breaking down methane may also be possible using model airplanes, equipped with LiPo batteries and with solar thin film mounted both on top of and underneath the wings. Numerous such planes could navigate to the Arctic by autopilot in summer, when there are high concentrations of hydrogen peroxide and when the sun shines 24-hours a day. Flying figure-8 patterns with the wings under an angle could optimize capture of sunlight, keeping the planes in the air, while using surplus energy to power UV lights. Another methods could be to focus UV light on ozone and mix it with volatile hydrocarbons, in an effort to produce hydroxyls. At the end of summer, the planes could return home for a check-up and possible upgrade of the technology, to be launched again early summer the next year.
Such methods are further discussed at this geoengineering group.

According to the press release, scientists onboard the vessel plan to take seafloor samples from a marine area in which fishery echosounders recently detected numerous gas flares. They indicate that probably enormous quantities of methane are released from the seafloor at water depths of around 400 metres west of Svalbard.
Scientists have been researching the potential for methane releases in the Arctic for years. One of the dangers with climate change is that hydrates could become destabilized, causing huge amounts of methane to be released, in turn accelerating warming.
The East Siberian Arctic Shelf is a region about 2,000,000 km2 large that, due to polar amplification of global warming, can now be 10°C or 18°F warmer than it was from 1951 to 1980 (NASA image below).
Shakhova and Semiletov (2010) conclude that this ESAS region should be considered the most potential in terms of possible climate change caused by abrupt release of methane.
A press release accompanying a widely-reported study published in Science in 2010 explains that in the shallows of the East Siberian Arctic Shelf, methane simply doesn't have enough time to oxidize, which means more of it escapes into the atmosphere. That, combined with the sheer amount of methane in the region, could add a previously uncalculated variable to climate models.
"The release to the atmosphere of only one percent of the methane assumed to be stored in shallow hydrate deposits might alter the current atmospheric burden of methane up to 3 to 4 times," Shakhova warns.
A 2008 paper by Shakhova et al. considered release of up to 50 Gt of predicted amount of hydrate storage as highly possible for abrupt release at any time. Such a release could multiply the atmospheric methane burden by up to 11 times.
2. Abrupt merthane releases
As permafrost melts, algae and bacteria can flourish, contributing methane through their metabolism. Even more worrying, collapse of methane hydrates can cause abrupt release of huge amounts of methane.
Rising temperatures can cause hydrates to collapse, resulting in abrupt release of huge amounts of methane. Anomolies of up to 12.5°C show up on the image below with average temperatures for November 2010.
For individual days and locations, the anomaly can be even more striking. On January 6, 2011, the minimum temperature in Coral Harbour, located at the northwest corner of Hudson Bay in the province of Nunavut, Canada, was –3.7°C (25.3°F), i.e. 30°C (54°F) above average.
How high can temperatures rise in the Arctic? Below are projections based on above NASA data.
Methane hydrates are held together by high pressure and low temperatures. They can collapse when the temperature rises, or when pressure falls, e.g. when hydrates are disturbed by earthquakes and associated tsunamis, shock-waves and land-slides. Thermal expansion of land and water can put additional stress on areas prone to seismic activity. Furthermore, as ice and glaciers in the mountains melt away, a substantial weight is disappearing, changing pressures that act on the Earth's crust and contribute to seismic activity. This link was confirmed in several scientific studies, such as this one dating back to 2003. Drilling and fracking in these hydrates could make things worse and trigger abrupt releases of huge amounts of methane.
Collapse of a single hydrate can accelerate local warming, in turn causing further hydrates to similarly start adding large amounts of methane to the atmosphere, as further described below.
3. Oxygen depletion
At the moment, methane releases from undersea sediments may still become oxidized in the water. However, a two-part study by Berkeley Lab and Los Alamos National Laboratory shows that, as global temperature increases and oceans warm, methane releases from clathrates would over time cause depletion of oxygen, nutrients, and trace metals needed by methane-eating microbes, resulting in ever more methane escaping into the air unchanged, to further accelerate climate change.

4. Hydroxyl depletion in the air
To make matters even more catastrophic, high methane concentrations will result in an absence of enough hydroxyl in the air for all this methane to be oxidized. A 2009 study by Drew Shindell found that increases in global methane emissions did cause a 26% hydroxyl decrease. Because of this, methane now persists longer in the atmosphere, before getting transformed into the less potent carbon dioxide.
A Centre for Atmospheric Science study suggests that sea ice loss may amplify permafrost warming, with an ice-free Arctic featuring a decrease in hydroxyl of up to 60% and an increase of tropospheric ozone (another greenhouse gas) of up to 60% over the Arctic. This lack of hydroxyl means that methane will persist in the atmosphere for longer at its high global warming potency.
5. Local concentration of methane
Earth has 510,072,000 km2 of surface, or more than 255 times that of the East Siberian Arctic Shelf. Initial concentration of that much methane in the Arctic makes things even worse. While methane can spread out quickly, it will initially be concentrated where it is released. A major methane release in the high Arctic would take 15-40 years to spread to the South Pole. This methane will allow less heat from sunlight in summer to escape into space, while the sun doesn't set. This could therefore cause summer temperatures to rise dramatically in the Arctic, in turn causing further melting and more warming than we're already witnessing now.
6. Methane's high initial Global Warming Potential
Particularly worrying about methane is its high global warming potential, which can be made worse due to the above points, i.e. lack of oxygen in water, resulting in ever less methane oxidation in water, hydroxyl depletion in the air and local concentration of methane. All this may increase methane's global warming potential.

In its first five years, methane is at least 100 times as potent as carbon dioxide as a greenhouse gas (above image below, from a study by Dessus). Abrupt releases of 15 Gt (or Pg) of methane would result in a burden of 20 Gt of methane (since there already is about 5 Gt in the atmosphere). Applying a global warming potential of 100 times carbon dioxide would give this 20 Gt of methane an initial greenhouse effect equivalent to 2000 Pg of carbon dioxide.
By comparison, atmospheric carbon dioxide levels rose from 288 ppmv in 1850 to 369.5 ppmv in 2000, for an increase of 81.5 ppmv, or 174 PgC. What makes things even worse is that this 174 PgC was spread out over the globe, whereas methane from such abrupt releases in the Arctic would - at least initially - be concentrated in a relatively small area.
Extension of methane's lifetime further amplifies its greenhouse effect, especially for releases that are two or three times as large as current releases.
The graph on the right, based on data by Isaksen et al. (2011), shows how methane's lifetime extends as more methane is released.
The GWP for methane typically includes indirect effects of tropospheric ozone production and stratospheric water vapor production. The study by Isaksen et al. shows (image below) that a scenario of 7 times current methane levels (image below,medium light colors) would correspond with a radiative forcing of 3.6 W/m-2.


An addition of less than 30 Pg of methane could create such a scenario (i.e. of 7x the methane we're used to having in the atmosphere) and this would extend methane's lifetime to some 18 years, so such a burden will not go away quickly. The situation is even worse when releases take place abruptly over a short period. A single submarine landslide can release 5 Pg of methane, which can double the methane currently in the atmosphere when this occurs in shallow waters, since such a huge release will saturate the water, so most methane will enter the atmosphere unchanged, to trigger further releases.
7. Runaway Global Warming
This kind of warming in the Arctic could result in ever more methane ending up in the atmosphere and remaining there for a longer period without getting oxidized. Initially, all this methane will be concentrated in the arctic, causing huge amplification of the greenhouse effect there in summer, heating up the sea and causing further depletion of oxygen (as algae start to bloom) and further accelerating the permafrost melt and thus causing further carbon to be released from permafrost and clathrates.
Such dramatic local warming is bound to trigger further melting of permafrost locally, resulting in further releases of methane. Massive amounts of methane are stored in the Arctic, much of it concentrated at high density in hydrates. One liter of hydrate can release up to 164 liters of methane. A rise in temperature could cause abrupt releases of huge amounts of methane from hydrates.
8. What can be done about it?
Once runaway global warming starts, it feeds on itself. While dramatic reduction in global greenhouse gas emissions is imperative, that alone will not be able to stop runaway global warming.

Even halving the amount of sunlight may not be enough to reduce rapid warming in the region, if that would merely be like cutting methane's GWP in half. Moreover, it can take several years for warming to reach and penetrate hydrate sediments, as described by Nesbit, and once on its way, reducing surface temperature may not be able to reverse such a process quickly enough to avoid massive methane releases. In other words, the window of opportunity for solar reduction methods may already have closed.
Further methods include ways to ignite the methane using short, amplified and focused pulses of UV light from airplanes or satellites. UV light could also be used to produce more hydroxyl, in efforts to oxidize as much methane as possible.
Igniting or breaking down methane may also be possible using model airplanes, equipped with LiPo batteries and with solar thin film mounted both on top of and underneath the wings. Numerous such planes could navigate to the Arctic by autopilot in summer, when there are high concentrations of hydrogen peroxide and when the sun shines 24-hours a day. Flying figure-8 patterns with the wings under an angle could optimize capture of sunlight, keeping the planes in the air, while using surplus energy to power UV lights. Another methods could be to focus UV light on ozone and mix it with volatile hydrocarbons, in an effort to produce hydroxyls. At the end of summer, the planes could return home for a check-up and possible upgrade of the technology, to be launched again early summer the next year.
Such methods are further discussed at this geoengineering group.
Sunday, January 16, 2011
2011 starts with lowest Arctic sea ice extent on record
The year 2010 was the warmest year on record, as confirmed by the WMO and as illustrated by the NOAA graph below.
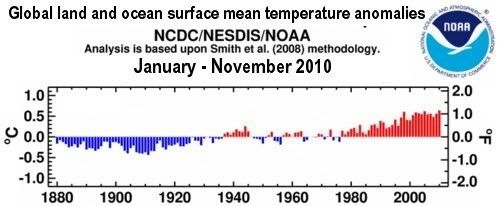 This is the more dramatic given that we’re in the middle of a strong La Niña, which pushes temperatures down, while we’ve been in “the deepest solar minimum in nearly a century.”
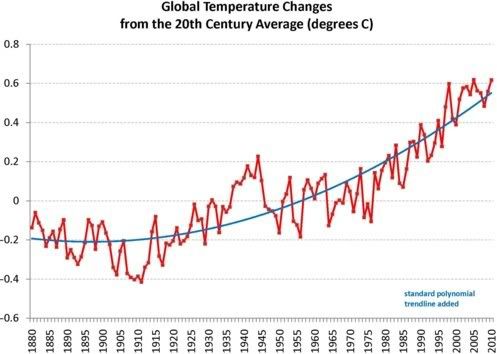
NOAA has meanwhile published the data for 2010. A chart based on NOAA data is added below, with standard polynomial trendline added.
This is the more dramatic given that we’re in the middle of a strong La Niña, which pushes temperatures down, while we’ve been in “the deepest solar minimum in nearly a century.”
NOAA has meanwhile published the data for 2010. A chart based on NOAA data is added below, with standard polynomial trendline added.
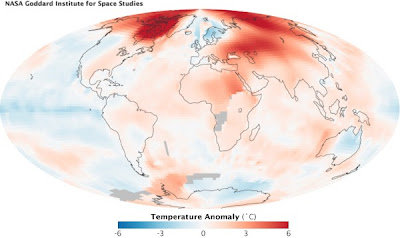
 As the NASA map below shows, temperature anomalies are especially prominent at higher latitudes, close to the Arctic.
 Arctic sea ice cover in December 2010 was the lowest on record for the month, said the WMO, adding that sea ice around the northern polar region shrank to an average monthly extent of 12 million square kilometres, 1.35 million square kilometres below the 1979 to 2000 December average. Furthermore, 2011 has started with the lowest Arctic sea ice extent on record for this time of the year, as shown on the International Arctic Research Center graph below.
 On the NSIDC graph below, monthly September ice extent for 1979 to 2010 shows a decline of 11.5% per decade.
 The NSIDC image below shows that, at the end of the summer 2010, under 15% of the ice remaining in the Arctic was more than two years old, compared to 50 to 60% during the 1980s. There is virtually none of the oldest (at least five years old) ice remaining in the Arctic (less than 60,000 square kilometers [23,000 square miles] compared to 2 million square kilometers [722,000 square miles] during the 1980s).
 Why is all this so important? The Arctic sea ice acts as a giant mirror, reflecting sunlight back into space and thus keeping Earth relatively cool, as discussed in this open letter. If this sunlight instead gets absorbed at higher latitudes, then feedback effects will take place that result in much higher temperatures, in a process sometimes referred to as Arctic amplification of global warming.
 Above image is from a recent study, which found that 2010 set a record for surface melting over the Greenland ice sheet.
The study warns that surface melt and albedo are intimately linked: as melting increases, so does snow grain size, leading to a decrease in surface albedo which then fosters further melt.
A recent study concludes that the rate of Arctic sea ice decline appears to be accelerating due to positive feedbacks between the ice, the Arctic Ocean and the atmosphere. As Arctic temperatures rise, summer ice cover declines, more solar heat is absorbed by the ocean and additional ice melts. Warmer water may delay freezing in the fall, leading to thinner ice cover in winter and spring, making the sea ice more vulnerable to melting during the next summer.
Above image is from a recent study, which found that 2010 set a record for surface melting over the Greenland ice sheet.
The study warns that surface melt and albedo are intimately linked: as melting increases, so does snow grain size, leading to a decrease in surface albedo which then fosters further melt.
A recent study concludes that the rate of Arctic sea ice decline appears to be accelerating due to positive feedbacks between the ice, the Arctic Ocean and the atmosphere. As Arctic temperatures rise, summer ice cover declines, more solar heat is absorbed by the ocean and additional ice melts. Warmer water may delay freezing in the fall, leading to thinner ice cover in winter and spring, making the sea ice more vulnerable to melting during the next summer.
The IPCC didn't take such feedbacks into account and didn't foresee a total September sea ice loss in the Arctic for this century. Many scientists have repeatedly warned about this, as mentioned in this early 2009 post and this early 2010 post.
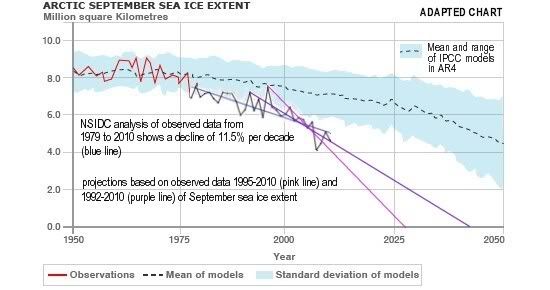 Projections that start with more recent data will take some of this feedback into account. Projections that start with 1992 and 1995 data, as in the pink and purple lines on above image, predict a total loss of September Arctic sea ice by 2040 or 2030. A study that used 2007/2008 data as starting point predicts a nearly sea ice free Arctic in September by the year 2037.
Albedo change is only one of a number of feedback processes. A rapid rise of Arctic temperatures could lead to wildfires and the release of huge amounts of carbon dioxide and methane that are now stored in peat, permafrost and clathrates, which constitutes further feedback that could cause a runaway greenhouse effect. Heat produced by decomposition of organic matter is yet another feedback that leads to even deeper melting.
Projections that start with more recent data will take some of this feedback into account. Projections that start with 1992 and 1995 data, as in the pink and purple lines on above image, predict a total loss of September Arctic sea ice by 2040 or 2030. A study that used 2007/2008 data as starting point predicts a nearly sea ice free Arctic in September by the year 2037.
Albedo change is only one of a number of feedback processes. A rapid rise of Arctic temperatures could lead to wildfires and the release of huge amounts of carbon dioxide and methane that are now stored in peat, permafrost and clathrates, which constitutes further feedback that could cause a runaway greenhouse effect. Heat produced by decomposition of organic matter is yet another feedback that leads to even deeper melting.
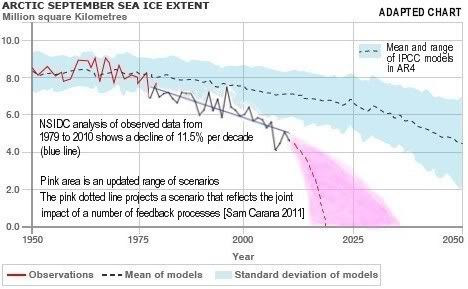 The cumulative impact of multiple feedback processes and their interaction reinforces and accelerates Arctic warming, making downward curved projections more applicable than straight line extrapolation of earlier data. The pink dotted line on above chart shows a scenario that reflects the impact of a number of feedback processes.
A study at the University of Calgary concludes that, even if we completely stopped using fossil fuels and put no more CO2 in the atmosphere, we've already added enough carbon in the oceans to cause the West Antarctic ice sheet to eventually collapse (by the year 3000), resulting in a global sea level rise of at least four meters. In other words, we have already passed the tipping point for the West Antarctic ice sheet, and additional emissions could cause its collapse to occur much earlier.
According to a study published in the journal Nature Geoscience, ice and snow in the Northern Hemisphere are now reflecting on average 3.3 watts of solar energy per square meter back to space, a reduction of 0.45 watts per square meter between 1979 and 2008. "The rate of energy being absorbed by the Earth through cryosphere decline – instead of being reflected back to the atmosphere – is almost 30% of the rate of extra energy absorption due to CO2 increase between pre-industrial values and today," co-author Karen Shell said.
A study by by National Center for Atmospheric Research (NCAR) scientist Jeffrey Kiehl found that carbon dioxide may have at least twice the effect on global temperatures than currently projected by computer models of global climate. Melting of ice sheets, for example, leads to additional heating because exposed dark surfaces of land or water absorb more heat than ice sheets.
Without changes, this new study warns, Earth's average temperature appears set to rise this century by 29°F (16°C), to levels never before experienced in human history. Such a rise would make that many areas on Earth would become too hot to live in.
Humans and other mammals cannot survive prolonged exposure to temperatures exceeding 95°F (35°C), says Steven Sherwood. Heat stress would make many parts of the globe uninhabitable with global-mean warming of about 7°C (12.6°F). Warming of about 21°F (11-12°C) would make places where most people now live uninhabitable.
I have made recommendations to deal with global warming for years, most recently in this Global Warming Action Plan.
What do you think should be done?
The cumulative impact of multiple feedback processes and their interaction reinforces and accelerates Arctic warming, making downward curved projections more applicable than straight line extrapolation of earlier data. The pink dotted line on above chart shows a scenario that reflects the impact of a number of feedback processes.
A study at the University of Calgary concludes that, even if we completely stopped using fossil fuels and put no more CO2 in the atmosphere, we've already added enough carbon in the oceans to cause the West Antarctic ice sheet to eventually collapse (by the year 3000), resulting in a global sea level rise of at least four meters. In other words, we have already passed the tipping point for the West Antarctic ice sheet, and additional emissions could cause its collapse to occur much earlier.
According to a study published in the journal Nature Geoscience, ice and snow in the Northern Hemisphere are now reflecting on average 3.3 watts of solar energy per square meter back to space, a reduction of 0.45 watts per square meter between 1979 and 2008. "The rate of energy being absorbed by the Earth through cryosphere decline – instead of being reflected back to the atmosphere – is almost 30% of the rate of extra energy absorption due to CO2 increase between pre-industrial values and today," co-author Karen Shell said.
A study by by National Center for Atmospheric Research (NCAR) scientist Jeffrey Kiehl found that carbon dioxide may have at least twice the effect on global temperatures than currently projected by computer models of global climate. Melting of ice sheets, for example, leads to additional heating because exposed dark surfaces of land or water absorb more heat than ice sheets.
Without changes, this new study warns, Earth's average temperature appears set to rise this century by 29°F (16°C), to levels never before experienced in human history. Such a rise would make that many areas on Earth would become too hot to live in.
Humans and other mammals cannot survive prolonged exposure to temperatures exceeding 95°F (35°C), says Steven Sherwood. Heat stress would make many parts of the globe uninhabitable with global-mean warming of about 7°C (12.6°F). Warming of about 21°F (11-12°C) would make places where most people now live uninhabitable.
I have made recommendations to deal with global warming for years, most recently in this Global Warming Action Plan.
What do you think should be done?
Arctic sea ice cover in December 2010 was the lowest on record for the month, said the WMO, adding that sea ice around the northern polar region shrank to an average monthly extent of 12 million square kilometres, 1.35 million square kilometres below the 1979 to 2000 December average. Furthermore, 2011 has started with the lowest Arctic sea ice extent on record for this time of the year, as shown on the International Arctic Research Center graph below.
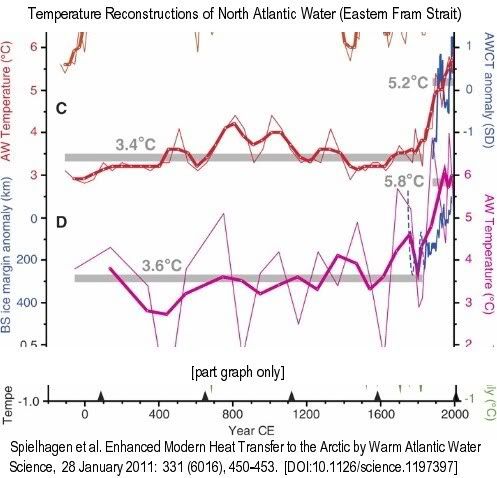 Thin lines are raw data, bold lines are three-point running means…. (C) Summer temperatures at 50-m water depth (red)…. Gray bars mark averages until 1835 CE and 1890 to 2007 CE. Blue line is the normalized Atlantic Water core temperature (AWCT) record … from the Arctic Ocean (1895 to 2002; 6-year averages)…. (D) Summer temperatures (purple) [calculated with a different method]
 |
| More on Global Warming: | More on Geoengineering: |
Saturday, June 26, 2010
Open letter on Arctic Sea Ice Loss

Open letter on Arctic Sea Ice Loss
The Arctic sea ice acts as a giant mirror to reflect sunlight back into space and cool the Earth. The sea ice has been retreating far faster than the Intergovernmental Panel on Climate Change (IPCC) predicted only three years ago [1]. After the record retreat in September 2007, many scientists revised their predictions for the date of a seasonally ice free Arctic Ocean from beyond the end of century to beyond 2030. Only a few scientists predicted this event for the coming decade, and they were ridiculed.
In 2008 and 2009 there was only a slight recovery in end-summer sea ice extent, and it appears that the minimum 2010 extent will be close to a new record [2]. However the evidence from PIOMAS is that there has been a very sharp decline in ice volume [3], which is very worrying.
The Arctic warming is now accelerating, and we can expect permafrost to release large quantities of methane, from as early as 2011 onwards, which could lead inexorably to runaway greenhouse warming and abrupt climate change. All this could become apparent if the sea ice retreats further than ever before this summer. We could be approaching a point of no return unless emergency action is taken.
We suggest that the current situation should be treated as a warning for us all. The world community must rethink its attitude to fighting global warming only by cutting greenhouse gas emissions sharply. Even if emissions could be cut to zero, the existing CO2 in the atmosphere would continue to warm the planet for many decades.
Geoengineering now appears the only means to cool the Arctic quickly enough. A geoengineering project of the intensity of the Manhattan Project is urgently needed to guard against a global catastrophe. A multi-disciplinary team of scientists and engineers should be tasked and resourced to assess the evolving situation in the Arctic and implement a strategy of parallel research, development, preparation and deployment for different geoengineering techniques, such as to minimise the risk of failure.
Yours sincerely,
John Nissen, MA (Cantab) Natural Sciences, Director of Cloudworld Ltd
Email jn@cloudworld.co.uk for correspondence
Other signatories
Stephen Salter, Emeritus Professor of Engineering, Edinburgh University
Peter Wadhams, Professor of Ocean Physics, Head of the Polar Ocean Physics Group, Cambridge University
Gregory Benford, Professor of Physics, University of California, Irvine
John Gorman, MA (Cantab), Chartered Engineer MIMechE, MIET - UK
Colin John Baglin, B.Eng. M.Sc. C.Eng. M.I.Mech.E.
Veli Albert Kallio, FRGS, FIPC Co-Ordinator, Greenland Ice Stability Project
Dr. Brian Orr, PhD control engineering, j.mp/BrianOrr
Tom Barker, BSc PhD, School of Environmental Sciences, University of Liverpool
Nicholas Maxwell, Emeritus Reader, University College London; author - j.mp/NickMaxwell
Donald A. Grinde, Jr., Professor and Chair, Department of American Studies
SUNY at Buffalo - americanstudies.buffalo.edu
SUNY at Buffalo - americanstudies.buffalo.edu
Sam Carana, contributor to Feebate.net and geo-engineering.blogspot.com
References
[1] Arctic sea ice decline: Faster than forecast, Stroeve et al, May 2007
http://www.smithpa.demon.co.uk/GRL%20Arctic%20Ice.pdf
[2] NSIDC daily images - National Snow and Ice Data Center, Boulder, Colorado
Reference image below dated June 24, 2010. For updates, see current daily image.
[3] Pan-Arctic Ice Ocean Modeling and Assimilation System (PIOMAS), University of Washington.
Original reference image dated May 30, 2010. Image below is dated June 18, 2010.

As NOAA reports that the May 2010 global temperature was the warmest on record, sea ice extent remains well below the 2007 record low, as shown on above NSIDC image.

Arctic Sea Ice Volume Anomaly calculated using the Pan-Arctic Ice Ocean Modeling and Assimilation System (PIOMAS), University of Washington.
Monday, May 4, 2009
Funding of Carbon Air Capture
Air capture of carbon dioxide is an essential part of the blueprint to reduce carbon dioxide to acceptable levels. Fees on conventional jet fuel seem the most appropriate way to raise funding to help with the development of air capture technology.
Why target jet fuel? In most other industries, there are ready alternatives to the use of fossil fuel. Electricity can be produced by wind turbines or by solar or geothermal facilities with little or no emissions of greenhouse gases. In the case of aviation, though, the best we can aim for, in the near future at least, is biofuel.
Technically, there seem to be no problems in powering aircraft with biofuel. Back in Jan 7, 2009, a Continental Airlines commercial aircraft (a Boeing 737-800) was powered in part by algae oil, supplied by Sapphire Energy. The main hurdle appears to be that algae oil is not perceived as price-competitive with fossil fuel-based jet fuel.
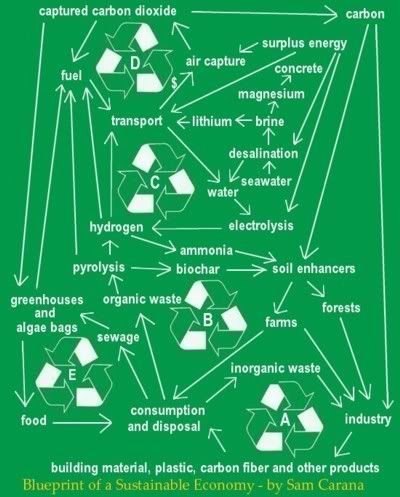
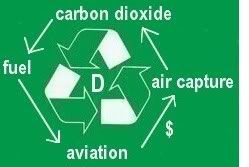 Additionally, the aviation industry can offset emissions, e.g. by funding air capture of carbon dioxide. The carbon dioxide thus captured could be partly used to produce fuel, which could in turn be used by the aviation industry, as pictured on the left. The carbon dioxide could also be used to assist growth of biofuel, e.g. in greenhouses.
Algae can grow 20 to 30 times faster than food crops. A CNN report, more than a year ago, mentions Vertigro's claim to be able to grow 100,000 gallons of algae oil per acre per year by growing algae in clear plastic bags suspended vertically in a greenhouse. Given the right temperature and sufficient supply of light, water and nutrients, algae seem able to supply an almost limitless amount of biofuel.
The potential of algae has been known for decades. As another CNN report describes, the U.S. Department of Energy (DoE) had a program for nearly two decades, to study the potential of algae as a renewable fuel. The program was run by the DoE's National Renewable Energy Laboratory (NREL) and was terminated by 1996. At that time, a NREL report concluded that an area around the size of the U.S. state of Maryland could cultivate algae to produce enough biofuel to satisfy the entire transportation needs of the U.S.
In conclusion, it would make sense to impose fees on conventional jet fuel and use the proceeds of those fees to fund air capture of carbon dioxide.
Additionally, the aviation industry can offset emissions, e.g. by funding air capture of carbon dioxide. The carbon dioxide thus captured could be partly used to produce fuel, which could in turn be used by the aviation industry, as pictured on the left. The carbon dioxide could also be used to assist growth of biofuel, e.g. in greenhouses.
Algae can grow 20 to 30 times faster than food crops. A CNN report, more than a year ago, mentions Vertigro's claim to be able to grow 100,000 gallons of algae oil per acre per year by growing algae in clear plastic bags suspended vertically in a greenhouse. Given the right temperature and sufficient supply of light, water and nutrients, algae seem able to supply an almost limitless amount of biofuel.
The potential of algae has been known for decades. As another CNN report describes, the U.S. Department of Energy (DoE) had a program for nearly two decades, to study the potential of algae as a renewable fuel. The program was run by the DoE's National Renewable Energy Laboratory (NREL) and was terminated by 1996. At that time, a NREL report concluded that an area around the size of the U.S. state of Maryland could cultivate algae to produce enough biofuel to satisfy the entire transportation needs of the U.S.
In conclusion, it would make sense to impose fees on conventional jet fuel and use the proceeds of those fees to fund air capture of carbon dioxide.
 Apart from growing algae in greenhouses, we should also consider growing them in bags. NASA scientists are proposing algae bags as a way to produce renewable energy that does not compete with agriculture for land or fresh water. It uses algae to produce biofuel from sewage, using nutrients from waste water that would otherwise be dumped and contribute to pollution and dead zones in the sea.
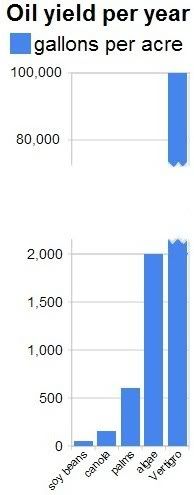 The NASA article conservatively mentions that some types of algae can produce over 2,000 gallons of oil per acre per year. In fact, most of the oil we are now getting out of the ground comes from algae that lived millions of years ago. Algae still are the best source of oil we know.
In the NASA proposal, there's no need for land, water, fertilizers and other nutrients. As the NASA article describes, the bags are made of inexpensive plastic. The infrastructure to pump sewage to the sea is already in place. Economically, the proposal looks sound, even before taking into account environmental benefits.
Jonathan Trent, lead research scientist on the Spaceship Earth project at NASA Ames Research Center, Moffett Field, California, envisages large plastic bags floating on the ocean. The bags are filled with sewage on which the algae feed. The transparent bags collect sunlight that is used by the algae to produce oxygen by means of photosynthesis. The ocean water helps maintain the temperature inside the bags at acceptable levels, while the ocean's waves also keep the system mixed and active.
The NASA article conservatively mentions that some types of algae can produce over 2,000 gallons of oil per acre per year. In fact, most of the oil we are now getting out of the ground comes from algae that lived millions of years ago. Algae still are the best source of oil we know.
In the NASA proposal, there's no need for land, water, fertilizers and other nutrients. As the NASA article describes, the bags are made of inexpensive plastic. The infrastructure to pump sewage to the sea is already in place. Economically, the proposal looks sound, even before taking into account environmental benefits.
Jonathan Trent, lead research scientist on the Spaceship Earth project at NASA Ames Research Center, Moffett Field, California, envisages large plastic bags floating on the ocean. The bags are filled with sewage on which the algae feed. The transparent bags collect sunlight that is used by the algae to produce oxygen by means of photosynthesis. The ocean water helps maintain the temperature inside the bags at acceptable levels, while the ocean's waves also keep the system mixed and active.
 The bags will be made of “forward-osmosis membranes”, i.e. semi-permeable membranes that allow fresh water to flow out into the ocean, while preventing salt from entering and diluting the fresh water inside the bag. Making the water run one way will retain the algae and nutrients inside the bags. Through osmosis, the bags will also absorb carbon dioxide from the air, while releasing oxygen. NASA is testing these membranes for recycling dirty water on future long-duration space missions.
As the sewage is processed, the algae grow rich, fatty cells that are loaded with oil. The oil can be harvested and used, e.g., to power airplanes.
In case a bag breaks, it won’t contaminate the local environment, i.e. leakage won't cause any worse pollution than when sewage is directly dumped into the ocean, as happens now. Exposed to salt, the fresh water algae will quickly die in the ocean.
The bags are expected to last two years, and will be recycled afterwards. The plastic material may be used as plastic mulch, or possibly as a solid amendment in fields to retain moisture.
The bags will be made of “forward-osmosis membranes”, i.e. semi-permeable membranes that allow fresh water to flow out into the ocean, while preventing salt from entering and diluting the fresh water inside the bag. Making the water run one way will retain the algae and nutrients inside the bags. Through osmosis, the bags will also absorb carbon dioxide from the air, while releasing oxygen. NASA is testing these membranes for recycling dirty water on future long-duration space missions.
As the sewage is processed, the algae grow rich, fatty cells that are loaded with oil. The oil can be harvested and used, e.g., to power airplanes.
In case a bag breaks, it won’t contaminate the local environment, i.e. leakage won't cause any worse pollution than when sewage is directly dumped into the ocean, as happens now. Exposed to salt, the fresh water algae will quickly die in the ocean.
The bags are expected to last two years, and will be recycled afterwards. The plastic material may be used as plastic mulch, or possibly as a solid amendment in fields to retain moisture.
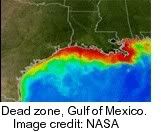 A 2007 Bloomberg report estimated that the Gulf of Mexico's Dead Zone would reach more than half the size of Maryland that year and stretch into waters off Texas. The Dead Zone endangers a $2.6 billion-a-year fishing industry. The number of shrimp fishermen licensed in Louisiana has declined 40% since 2001. Meanwhile, U.S. farmers in the 2007 spring planted the most acreage with corn since 1944, due to demand for ethanol. As the report further describes, the Dead Zone is fueled by nitrogen and other nutrients pouring into the Gulf of Mexico, and corn in particular contributes to this as it uses more nitrogen-based fertilizer than crops such as soybeans.
The Louisiana coast seems like a good place to start growing algae in bags floating in the sea, filled with sewage that would otherwise be dumped there. It does seem a much better way to produce biofuel than by subsidizing corn ethanol.
According to zFacts.com, corn ethanol subsidies totaled $7.0 billion in 2006 for 4.9 billion gallons of ethanol. That's $1.45 per gallon of ethanol (or $2.21 per gallon of gas replaced). As zFacts.com explains, besides failing to help with greenhouse gases and having serious environmental problems, corn ethanol subsidies are very expensive, and the political backlash in the next few years, as production and subsidies double, will damage the effort to curb global warming.
At UN climate talks in Bonn, the world's poorest nations proposed a levy of about $6 on every flight to help them adapt to climate change. Benito Müller, environment director of the Oxford Institute for Energy Studies and author of the proposal, said that air freight was deliberately not included. The levy could raise up to $10 billion per year and would increase the average price of an international long-haul fare by less than 1% for standard class passengers, but up to $62 for people traveling first class.
In the light of those amounts, it doesn't seems unreasonable to expect that fees imposed on conventional jet fuel could raise billions per year. Proceeds could then be used to fund rebates on air capture of carbon dioxide, which could be pumped into the bags on location to enhance algae growth. Air capture devices could be powered by surplus energy from offshore wind turbines. With the help of such funding, the entire infrastructure could be set up quickly, helping the environment, creating job opportunities, making the US less dependent on oil imports, while leaving us with more land and water to grow food, resulting in lower food prices.
A 2007 Bloomberg report estimated that the Gulf of Mexico's Dead Zone would reach more than half the size of Maryland that year and stretch into waters off Texas. The Dead Zone endangers a $2.6 billion-a-year fishing industry. The number of shrimp fishermen licensed in Louisiana has declined 40% since 2001. Meanwhile, U.S. farmers in the 2007 spring planted the most acreage with corn since 1944, due to demand for ethanol. As the report further describes, the Dead Zone is fueled by nitrogen and other nutrients pouring into the Gulf of Mexico, and corn in particular contributes to this as it uses more nitrogen-based fertilizer than crops such as soybeans.
The Louisiana coast seems like a good place to start growing algae in bags floating in the sea, filled with sewage that would otherwise be dumped there. It does seem a much better way to produce biofuel than by subsidizing corn ethanol.
According to zFacts.com, corn ethanol subsidies totaled $7.0 billion in 2006 for 4.9 billion gallons of ethanol. That's $1.45 per gallon of ethanol (or $2.21 per gallon of gas replaced). As zFacts.com explains, besides failing to help with greenhouse gases and having serious environmental problems, corn ethanol subsidies are very expensive, and the political backlash in the next few years, as production and subsidies double, will damage the effort to curb global warming.
At UN climate talks in Bonn, the world's poorest nations proposed a levy of about $6 on every flight to help them adapt to climate change. Benito Müller, environment director of the Oxford Institute for Energy Studies and author of the proposal, said that air freight was deliberately not included. The levy could raise up to $10 billion per year and would increase the average price of an international long-haul fare by less than 1% for standard class passengers, but up to $62 for people traveling first class.
In the light of those amounts, it doesn't seems unreasonable to expect that fees imposed on conventional jet fuel could raise billions per year. Proceeds could then be used to fund rebates on air capture of carbon dioxide, which could be pumped into the bags on location to enhance algae growth. Air capture devices could be powered by surplus energy from offshore wind turbines. With the help of such funding, the entire infrastructure could be set up quickly, helping the environment, creating job opportunities, making the US less dependent on oil imports, while leaving us with more land and water to grow food, resulting in lower food prices.
Monday, April 20, 2009
Open Letter to Major Economies Forum on Energy and Climate
Forum Participants,
We, a group of scientists, researchers and other people sharing a strong background and interest in climate change, are concerned that the Forum's sole focus will be on the politics of energy, as seems confirmed by the name of the Forum.
We believe that the scientific evidence strongly suggests that the approach to the climate change problem should be as broadly based as possible. As such, this should include the following four parts:
Part A: Emissions reduction
Part B: Carbon stock management
Part C: Heat transfer and radiation management
Part D: Adaptation
We note that there is little or no funding for research and testing of geoengineering methods (in Part B and Part C). These should be urgently considered as part of a comprehensive approach to climate change.
Signatories:
- John Nissen (jn@cloudworld.co.uk)
- Andrew Lockley (Former director of Friends of the Earth ENWI - UK)
- Peter Read (Hon. Research Fellow, Massey University Centre for Energy Research - NZ)
- Bill Fulkerson (Senior Fellow, Institute for a Secure and Sustainable Environment, University of Tennessee)
- Dan Wylie-Sears
- Eugene I. Gordon
- John Gorman (MA (Chartered Engineer MIMechE, MIET - UK)
- Jim Woolridge (former Climate and Energy Campaigner, Earthwatch/Friends of the Earth, Ireland)
- Sam Carana (contributor to feebate.net - sam.carana@gmail.com)
References:
White House Announcement of Major Economies Forum (MEF)
White House Announcement of Mexico MEF Meeting
Department of State Annoucement of MEF
Open letter to Dr Rajendra K. Pachauri, IPCC chair (Gather)
Open letter to Dr Rajendra K. Pachauri, IPCC chair (Geo-engineering)
Open Letter to Major Economies Forum Participants (background)
Wednesday, December 31, 2008
Considerations for New Year
Many of the graphs relating to global warming are exponential, rather than linear. The amount of carbon dioxide in the atmosphere is rising at accelerating speed, unlike anything that has been seen in history. This in itself is sufficient reason for alarm.
Additionally, there are scenarios in which the combination of several tipping points can lead to a runaway greenhouse gas effect that feeds on itself through positive feedback mechanisms. For an example, read about the Clathrate Gun Hypothesis.
For decades, people have warned about this.
Back in the early 1990s, a poll of the world's leading climatologists showed that many feared that the greenhouse effect could be unstoppable if emissions of polluting gases were merely frozen and not cut. In December 1991, Greenpeace asked 400 climate scientists if they thought the greenhouse effect might reach the point of no return in the near future. Of the 113 scientists who returned their questionnaires, almost half thought a runaway greenhouse effect is possible, and 13 per cent thought it probable.
James Hansen, who heads the NASA Goddard Institute for Space Studies, recently said that human activity is causing greenhouse gas levels to rise so rapidly that his model suggests there is a risk of a runaway greenhouse effect, ultimately resulting in the loss of oceans and of all life on the planet:
"In my opinion, if we burn all the coal, there is a good chance that we will initiate the runaway greenhouse effect. If we also burn the tar sands and tar shale (a.k.a. oil shale), I think it is a dead certainty." I discussed this danger in the article Venus' runaway greenhouse effect a warning for Earth, originally posted and discussed at Gather.
"In my opinion, if we burn all the coal, there is a good chance that we will initiate the runaway greenhouse effect. If we also burn the tar sands and tar shale (a.k.a. oil shale), I think it is a dead certainty." I discussed this danger in the article Venus' runaway greenhouse effect a warning for Earth, originally posted and discussed at Gather.
Even if the risk of such scenarios occurring on Earth were small, it makes sense to do the following:
- describe risk and estimate chances of manifestation, timelines, etc.
- identify tipping points, feedback mechanisms and give estimate ranges of their combined impact
- investigate ways to avoid it, mitigate it, etc.
- conduct comparative analysis of the various proposals
- make recommendations
SCIENCE
Existing studies - Are relevant studies available? Has there been any peer-review?
Further study - What further studies and modeling are required?
Effectiveness - How effective will the proposal be in reducing global warming?
Timescale - How long will it take to see results?
Concerns - What are possible climate risks, side-effects, dangers?
ENGINEERING
Methods - How can it be done? Have specific methods been proposed?
Technical problems - Could the project run into technical problems?
Technologies - Does the project require development of new technologies?
Testing - Has any testing been done? At what scale?
ECONOMICS
Cost - Are there estimates as to what (each of the various stages of) implementations would cost?
Financing - How could the project be financed? Is there any backing for the project?
Resources - Will there be access to the various resources needed to make it work?
Impact - What will be the economic impact? Who will profit from the project?
POLITICS
Approval - What kind of approvals are needed to go ahead?
Subsidies - Are subsidies required for impact studies, feasibility studies or for specific parts of the project?
Policy - How does the project fit in with specific policies, e.g. offset policies, emissions trading or feebates?
Legal - Does it require new laws or amendment of existing laws? Can legal challenges be expected?
Diplomacy - Would the project require international negotiations between nations?
Administration - From where will the project be administered?
SOCIAL AND MEDICAL
Support - Is there public support for, concern about or resistance against the project?
Consultation - Who will benefit, who could be harmed? Has the public been consulted?
Control - What level of policing, supervision and security is needed? What monitoring is needed?
Medical - Would the project pose safety and health concerns?
Cultural - Does the project offend some people in some way?
ENVIRONMENT
Impact study - Has an environmental impact assessment been done? Are further studies required?
Maintenance - Is any monitoring, maintenance or restoration required, to prevent environmental damage?
The above points could give some indication as to how hard it will be to implement a proposed project. Projects could be scored on each point by asking whether this point will raise any difficulties for the respective project. A high score would indicate that little or no difficulty on this point can be expected for the project, while a low score would indicate that the project can be expected to have difficulty on this point.
Each point could be given a specific weighting, resulting in overall score for each of the projects. The higher the overall score, the more the project should be of interest to members of this group. A high overall score should indicate that there is sufficient confidence that the project is safe, effective, feasible, viable, etc, with little or no concern, risk or danger that things could go wrong or that a proposal could cause damage or harm in some way.
Importantly however, this should not be seen as a race where only one winner is selected. It is prudent to encourage diversity in approach and to continue to study multiple ideas and suggestions in parallel. I encourage others to suggest additions and changes to this post.
Cheers!
Sam Carana
"We all hope that things will turn out right, but we must think about what to do, in case it doesn't!"
Links:
Clathrate Gun Hypothesis - Wikipedia
Runaway greenhouse warming 'cannot be rule out' - by STEPHANIE PAIN - February 15, 1992
http://www.newscientist.com/article/mg13318081.600
NASA scientist warns of runaway global warming - New Scientist - December 22, 2008
Venus' runaway greenhouse effect a warning for Earth - by Sam Carana - November 28, 2007
Ranking the ideas - post by Sam Carana, December 27, 2008
http://groups.google.com/group/geoengineering/msg/751aa59e3cc5e8ff
A naive question - post by Sam Carana, December 31, 2008
Tuesday, November 4, 2008
Inventory of geo-engineering proposals
Geo-engineering proposals seeking to combat global warming should be assessed according to efficacy, cost, risk, timeframe and the rate at which they can mitigate climate change, says Philip W. Boyd of New Zealand's NIWA in an article published in Nature Geoscience.
We need more thought on whether proposals like carbon burial, geochemical carbon capture, atmospheric carbon capture, ocean fertilization, cloud manipulation, space sunshades, or strategically-placed pollution can be effective on a time-scale relevant to humankind, economical, or even safe.
Meanwhile, AP reports that John Shepherd will head a working group at Britain's Royal Society to study geo-engineering proposals, with a report expected to be published in mid-2009.
Subscribe to:
Posts (Atom)